Introduction to spkGraph
spkGraph will allow you to simply create a graphical representation of your water supply and system demand requirements for fire sprinkler systems.
spkGraph will allow you to create the following types of graphs:
NFPA style graph with the water supply curve and displaying the most remote area system pressure and demand point. This is charted on a graph paper where the flow scale is logarithmic to the power of 1.85.
BS 9251:2014 Maximum flow demand calculation graph as outlined in annex C. For this type of graph you input the water supply curve height the highest sprinkler, the most remote and most favourable the demand points. For this chart the flow scale is plotted with a logarithmic scale to the power of two (square law).

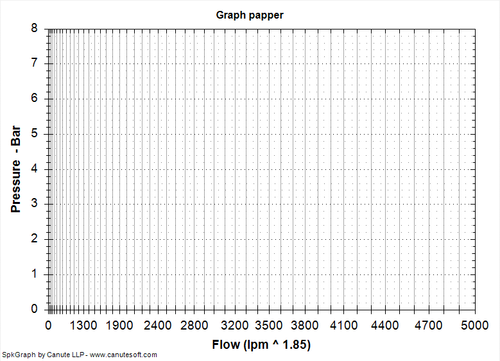
spkGraph can also produce graph paper with a flow and pressure scale which you define and you can also specify if the flow scale axis is logarithmic to the power of two or the power of 1.85